Run Safe
A Chrome extension that brings public safety context into Google Maps, helping runners understand an area, compare routes, and make more informed decisions.
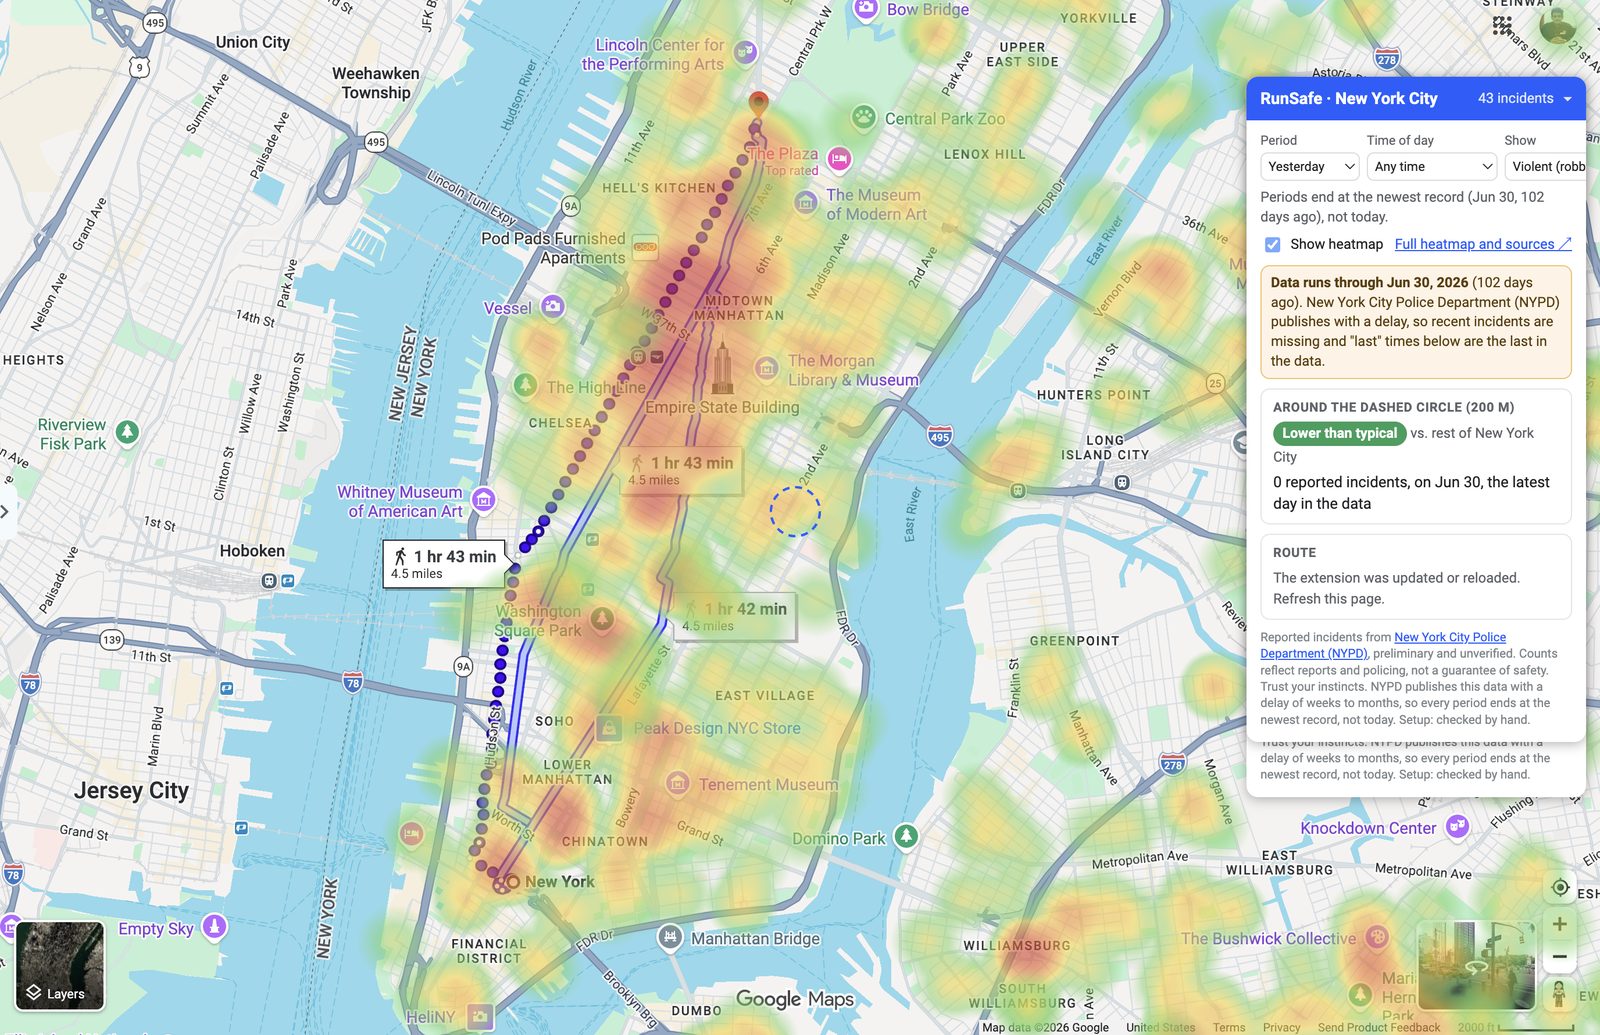
Know the route before you run it.
Safety information is often disconnected from the moment a person chooses a route. Run Safe places live public police records directly inside the map, alongside directions and the location itself.
The product separates data from certainty. It shows freshness, coverage limits, raw records, and clear caveats so a rating is a decision aid, not a claim that a place is safe or unsafe. Every dot links to the unedited source record.
Three steps, no store.
- Download the zip and unzip it.
- Open chrome://extensions (Chrome, Edge or Brave) and switch on Developer mode.
- Click Load unpacked, pick the unzipped runsafe folder, then open Google Maps in a covered city.
It is not on the Chrome Web Store yet, which is why it installs this way. To update, download the new zip, unzip it over the old folder and click the reload arrow on the extension card.
From map to decision in a minute.
- Open Google Maps and go to one of the 18 covered cities. A blue Run Safe card appears at the top right.
- Pick a period (yesterday to last year), a type (violent, property or all) and a time of day (any, daylight or after dark). The heatmap updates.
- Read the area rating for the dashed circle in the middle of the map: how that spot ranks against the rest of the same city, with counts by crime type and when something last happened there.
- Zoom in past level 16 and click a dot, or a row in the card, to see the incident details and a link to the original police record.
- To rate a run, open Directions, set a start and end, and choose walking. Run Safe draws an approximate on-foot route colored green to red by nearby incidents and summarizes it.
- Click Full heatmap and sources in the card for a large map with a city switcher, an hour-of-day chart, a CSV download and the data sources.
The toolbar icon shows or hides the overlay on Google Maps. Check the "data updated through" date on the card: each city publishes on its own schedule, so some are a few days behind. Ratings are a decision aid, not a guarantee of safety.
18 areas, named.
- New York
- Chicago
- Seattle
- Philadelphia
- Charlotte
- Baltimore
- Boston
- Raleigh
- Las Vegas
- Fort Worth
- Long Beach
- Detroit
- Denver
- Nashville
- Tucson
- Sacramento
- Columbus
- Rochester, NY
These are 17 of the 50 largest US cities plus Rochester, NY. Ratings only compare places within the same city, because each police department defines and counts crime differently. Suburbs are separate agencies and are not covered.
Checked and left out, on purpose. San Francisco: its public feed has only about 270 incidents a month, so it is incomplete and would mislead. Los Angeles: its locations are rounded to about 1 km, too coarse to rate a 200 m area.
Coming next. Oakland, California, and Tacoma, Washington.
A map overlay built for clarity.
Incident heatmap
Filter reported incidents by period (yesterday to last year), type and time of day while exploring a covered city.
Route rating
See an approximate on-foot route colored by nearby incident density.
Freshness signals
Understand when the source was last updated and how recent the displayed data is.
Traceable records
Inspect individual incidents and follow the link back to the underlying public record.
Public data needs public caveats.
Run Safe treats data quality, city-by-city differences, and coverage gaps as part of the product experience. Rochester and New York City were checked by hand; the remaining coverage is generated and validated through a source-mapping pipeline. The repo includes smoke, live, and background tests, plus source-specific adapters for ArcGIS and Socrata data.